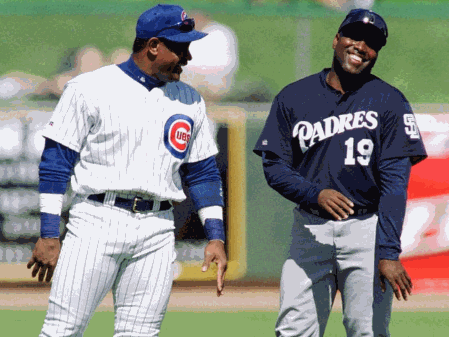
Sammy Sosa's 1994 Season: A SASRmetric Analysis
Written by Professor Ian Corkscrew - March 23, 2020

The baseball community currently
primes beneath the prospect of the 2020 season being even
shorter than any of the shortened seasons which have
happened throughout our game’s grand history. This shall
make it possible that the statistics all of us spend our
time studying in addition to holding up against the examples
of history will play outout in a sample size that is smaller
than we have any historical comparison for. Some experts
think that statistics from a season with fewer than 100
games cannot even exists compared to a 162 or 154 season.
Some wonder if whoever wins the
Championship in this coming season, along with any award
winners, can truly hold the same prestige as the men who
came before them.
Shortened seasons have always been
statistical anomalies for academics such as myself. In the
case of 1994, admirers of Tony Gwynn insist that the
splendid contact hitter’s .394 batting average would have
exceeded .400 if given the proper sample size, while
Montreal Expos, Cleveland Indians, Chicago White Sox, and
New York Yankees fans all debate who has the most rightful
claim to that year’s vacant championship. What is overlooked
by the intelligentsia is the outstanding season Sammy Sosa
was putting together in 1994 before the season was
cancelled.
Sosa finished the season with a
slashline of .300/.339/.545 – career highs in those
qualitative rate statistics at that point in his young
career. Of course, his quantitative counting stats pale in
comparison to his those from the 1993 season in which he
played 159 games, however the 25 home runs he did hit in his
426 opportunities account for an HR% over 5%, which means
that he would have equaled his then-career high of 33 home
runs if given his average amount of At-Bats.
While
any reasonable fellow would admire Sosa’s first .300 Batting
Average, certain opponents of mine may note his .339 On-Base
Percentage as less desirable. Indeed, Sosa drew precisely as
many Bases on Balls as he hit home runs, but perhaps that
was for the best. During the 24 games in which Sosa walked,
Sosa drove in and/or scored multiple runs (RsRBI) in 11
games, outnumbered by the 13 games in which he drew a walk,
but ultimately scored and/or drove in one or zero runs. One
would hypothesize from that figure that it was perhaps best
that Sosa did not walk all that often; the experiment
verifies this hypothesis because Sosa over 80 of Sosa’s
combined RsRBI came in games where he did not walk.
Given that Sosa’s best double-digit
game streak came with an astonishing slashline of
.341/.413/.585, along with the second-lowest strikeout
percentage of his career (second only to his fabulous 2005
season), it appears obvious that he had the plate discipline
to walk more, but consciously chose not to in order to
stimulate run production. The 1994 season contains another
demonstration of Sosa’s strategic genius. In 35 plate
appearances in which the Average Leverage Index was more
than twice what is considered to be high pressure, Sosa’s
OBP was .371. Perhaps the Chicago Cubs, who finished the
shortened season below .500, might be able to join their
crosstown mates in speculating about the World Series that
wasn’t, if one compiled evidence that the team was willing
to rally behind Sosa as a leader. A winning lineup always
begins with the leadoff hitter, and Sosa slashed
.315/.345/.713 in games where he lead off; 10 of his home
runs and 22 of his runs batted in also came in such games.
For comparison, the greatest leadoff hitter of all time,
Rickey Henderson, received MVP votes in five different
seasons in which he hit 10 or fewer home runs for the entire
season.
Statistics compiled within shortened
seasons will always carry questions about how they can be
compared to completed season collections, but there will
never be much question about how to compare players to their
contemporaries in the shortened season. Sammy Sosa’s 22
stolen bases were the most of any right fielder in 1994, and
his 9.8 defensive rating was the third best in the league
for his position.
The right fielder who receives the
most praise for his 1994 season, the aforementioned Tony
Gwynn, whatever his batting average might have been,
finished the year with an fWAR within the margin of error of
Sosa’s. It is time that we give Sammy Sosa his due for what
might have been in 1994.
